Capital Markets - SO HOT RIGHT NOW

February 2021
IN THIS ISSUE:
We take a look at macro and micro trends in the world of equity issuance via private placements as the capital markets sector continues to be red hot.
The number of private placement transactions is up materially, the total dollars raised is up, and the average deal size is up. Most sectors are benefiting with industrials the clear winner.
Ultimately, we want to emphasize the need for private lenders to stay up to speed on all capital markets activity (not just debt deals) as they all impact the risk profile of files on your books or new potential business
FOLLOW THE MONEY TO SEE THE RISING TIDE FLOATING ALL BOATS
Capital needing to be put to work, lofty equity valuations, and historically low interest rates are throwing gas on the fire in the capital markets world where private placements and M&A activity is burning red hot. Continuing our theme of capital access contributing to a robust M&A outlook for 2021, this month we are peeling the onion back another layer and digging into sector specific private placements (i.e. equity issuance). From a lender perspective, knowing a company or sector has access to capital outside of debt is comforting, and ultimately provides that respective company easier access to debt along the way.
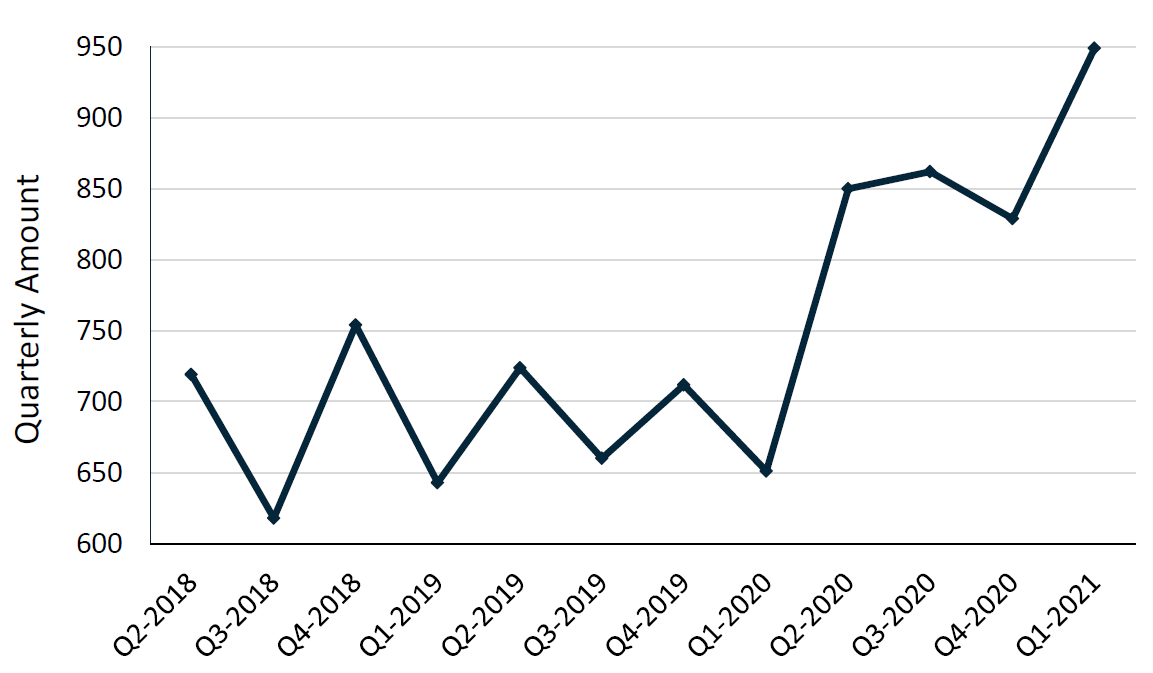
Really since the beginning of the pandemic, we have seen a meaningful uptick in the number of companies accessing equity in the public markets. The initial uptick seen in Q2-2020 was likely driven by companies shoring up their balance sheet in the face of the unknown. Arguably more impressive is the follow on we have seen with Q3 & Q4 2020 numbers holding around 850 equity deals per quarter (vs historical norm of around 700). Q1-2021 was even more eye-popping with 950 private placement equity raise transactions either completed or announced in the quarter.
On the following pages, we drill down to the sector-specific trends and based on our analysis, the industrials sector has seen the largest step change when it comes to capital access. That being said, most sectors are seeing an increase in capital access, indicating the rising tide is leaving no boats behind.
Quarterly Number of Canadian Private Placements
HOW MUCH IS BEING RAISED AND WHO IS RAISING THIS CAPITAL?
While the absolute number of private placements points to increased activity and capital access, we need to dig a little deeper to flush out how much capital is being raised and generally speaking, what sector is obtaining access to that capital.
Aggregate dollar amounts also pushing higher – In conjunction with the number of deals trending higher since the start of the pandemic, the total amount of money raised via private placement has also marched higher. Again, the spike of capital raised in Q2-2020 would likely reflect companies shoring up their balance sheet. For reference, Q1- 2021 saw total dollars raised in excess of $9 Bln USD, a 72% increase from 2019 averages.
Average issuance size remains robust – Also pointing to robust capital access for companies looking at the private placement market, the average deal size over the last 2 quarters sits in the $10 million USD range meaning we are seeing more and larger deals get done.
Canadian Quarterly Private Placement Totals and Average Deal Size ($USD)

Proportion of Quarterly Private Placements by Sector: Q1-2021 vs Historical AVG

WHAT SECTOR IS SEEING THE MOST SUPPORT?
When looking at the historical average of proportion of capital raised, the Materials sector has dominated with Health and Information Technology sitting in second and third respectively. In terms of recent financings, the industrial sector is a clear winner making up 15% of all capital raised in Q1-2021, nearly double its historical average. Capital raised was down for Real Estate, Consumer Discretionary and Consumer Service.
WHEN IT COMES TO PRIVATE PLACEMENTS, SIZE MATTERS
Combining the proportion of private placement capital raised (a percent of total raised in a respective quarter), with the number of transactions gets us to the average deal size per transaction. Seeing an increase in deal size is a very encouraging indicator of capital access, which again puts the industrials sector on top as we have seen a material increase in the size of deals seen in the most recent quarter versus the historical average. Communication Services (media and gaming) has also seen a large uptick in the average deal size which last quarter was in excess of $20 million/deal.
What’s up the Real Estate and Utilities Sector?– Private placement data in these two sectors can be a bit misleading as both of these sectors tend to have the characteristics of a low number of larger deals with some extreme volatility in the number of transactions on a quarterly basis. This is largely driven by the lower number of companies in the respective sectors and business models that generally only require access to public capital when acquisition opportunities arise.
Private Placement Average Deal Size ($ Mln USD): Q1-2021 vs Historical AVG

SO, WHAT DOES ALL OF THIS MEAN FOR A LENDER?
Equity and debt transactions are typically viewed in isolation, but the reality is sector specific capital access (whether debt or equity) and M&A activity all need to be taken in consideration when assessing the risk profile of a debt agreement. Lenders who keep their finger on the pulse of capital markets activity position themselves with a competitive advantage as the risk profile for a sector that has seen a significant increase in capital access is materially different than those that haven’t. Beyond this, knowing the M&A market is positioned to remain robust should give lenders added comfort.
Some of our key takeaways:
Private placement activity is the strongest we have seen in years with Q1-2021 dollars raised 72% above 2019 levels.
All sectors seem to be participating but industrials (think Clean-Tech) is seeing the most significant improvement in capital access with more and larger deals getting completed.
Until we see a significant market correction, private placement activity will remain strong as the amount of sidelined capital continues to set records. For those that have made it this far, congratulations.
Also, in reference to this month’s title, can you believe Zoolander came out 20 years ago? That is right around the time our new summer student was born, but we digress.
Sources: Capital IQ, Diamond Willow Advisory.