Feeling Insecure with your Security?

September 2020
IN THIS ISSUE:
Recent auction data suggests we are seeing the same number of overall items sold YTD (vs 2019) with a small increase in popular heavy equipment. No meaningful change in prices yet.
Wide bid ask spread on commercial real estate in Prairie provinces has prohibited meaningful data points. This is expected to change by mid Q4.
Despite overall consumer spending recovering to year ago levels, travel, transit and entertainment industries remain under pressure.
HOLDING OUR BREATH AS WE WAIT FOR NEW DATA POINTS
We have to admit that this month’s research topic is a total can of worms, but given our nature, we wanted to peel back the top of the can to have a peek inside. Underlying loan security is making plenty of lenders nervous these days as many anticipate a gap down in the asset values backstopping lending commitments. Whether capital providers are leaning on hard asset value (i.e. equipment), commercial real estate, or cash flow (cash is still king) there is plenty of uncertainty, and rightfully so.
In order to help provide some markers of the current state of the market we dug through recent auction data, commercial real estate market research, and consumer spending patterns. Despite the effort, our takeaways were not overly dramatic as the market for hard assets has yet to transact in a meaningful way. We have yet to see a material uptick in auction volume and heavy asset values continue to be resilient while the bid ask spread on real estate has prohibited any meaningful transactions to this point.
What does this mean for lenders? Its not a stretch to think market values for equipment and certain commercial real estate is primed to take a step down but until we have meaningful data points, lenders most likely need to increase their comfort level by offering lower Loan to Value (LTV) ratios. This ultimately means less money to borrowers or higher debt servicing costs (interest rates) as borrowers need to compensate lenders willing to offer higher LTV’s on the security backstopping the loans. We anticipate having meaningful market data points by mid Q4’2020 with all signs pointing to a gap down in security values, another headwind for those looking to access credit.
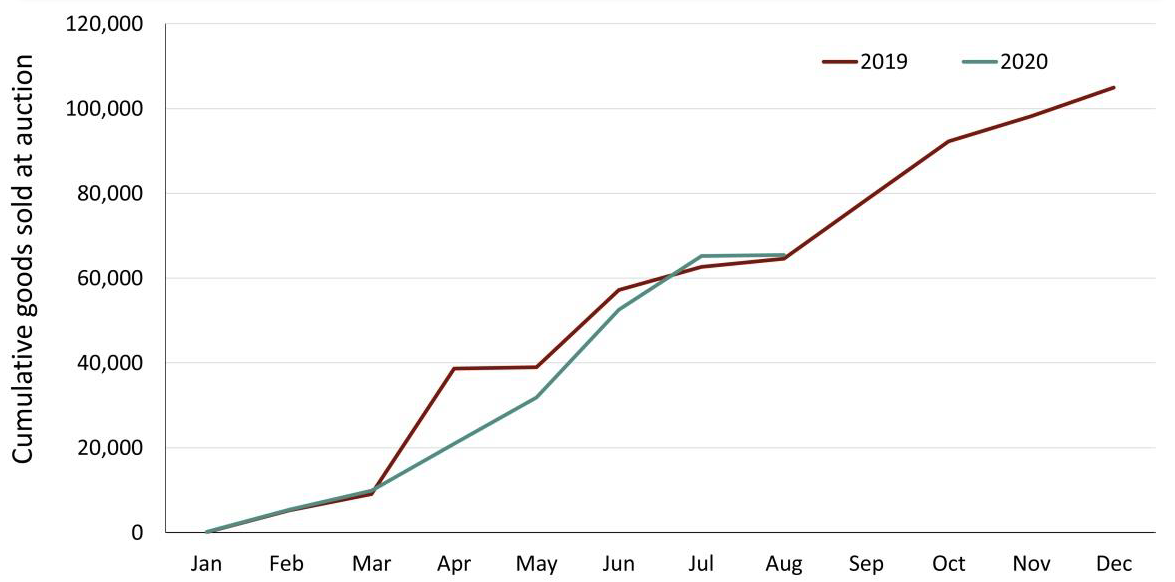
Richie Brothers - Total Number of Items Sold At Canadian Prairies Auctions (2020 vs 2019)
SIFTING THROUGH THE DATA - FOCUS ON CANADIAN PRAIRIES AUCTION RESULTS
Equipment and hard asset lenders tend to rely on auction activity to determine the security value they lend against. In an effort to provide an indication of updated equipment values we looked at trends in selling activity and prices for large pieces of equipment that transact on a regular basis. We fully admit this was not an exhaustive exercise (we focussed on the Canadian Prairie region results) but the results clearly point to trends for the auctions we scrutinized. Our main takeaways include:
The amount of larger equipment sold at auction sits slightly above year-ago levels after seeing a significant lag in March-May due to the pandemic. The chart on the previous page displays all goods listed at auction which is flat year over year, while our analysis indicates larger, heavy equipment has seen a slight uptick (~10% vs 2019 volume)
We will be watching the remainder of September / October results as historically ~25% of total goods sold during the year occur in these months, which lines up well with the conclusion of government support programs and likely any payment deferrals from equipment lenders/ lessors.
Selling prices holding steady - A degree of standardization needs to occur in order to properly compare pricing trends. In our case, we examined pricing paid per hour of operation from the same model of excavator (2016-2019 vintage) with 4,500-5,500 hours of operation. Despite 10% more excavators moving year to date (vs 2019), price paid per hour of operation was largely in line with prices seen in mid-2019.
Cumulative Sold - Truck Tractors 2019 vs 2020

Cumulative Sold - Excavators 2019 vs 2020

Price paid per hour of operation - Excavators

STANDARDIZED SELLING PRICE
While we have not seen a meaningful change in the price paid for large pieces of equipment like excavators, we will be keeping a watchful eye on October data as we anticipate inevitable softness as government support and lender deferral programs are concluding.
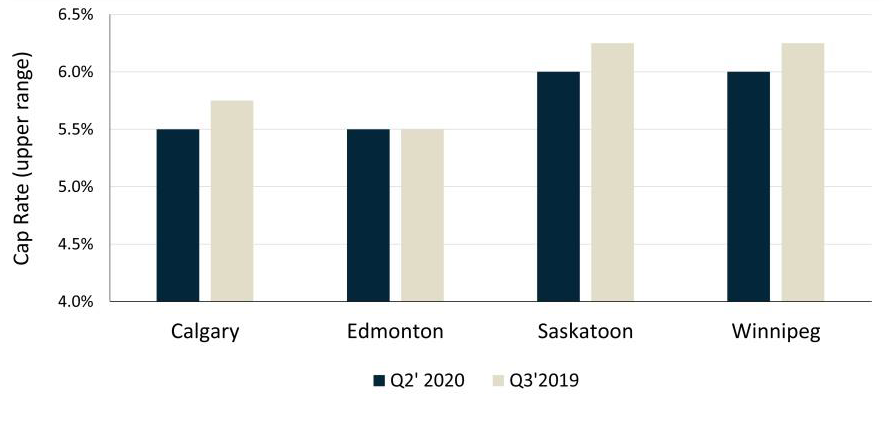
Industrial Cap Rates

Retail Cap Rates
COMMERCIAL REAL ESTATE - PRAIRIES STARVED FOR DATA POINTS
Despite cracks starting to show in the Calgary commercial real estate market with marginal increases seen in cap rates for the various asset classes (CBRE Q2’2020 report), in Edmonton, Saskatoon and Winnipeg cap rates have largely sat unchanged over the past year. As we enter Q4’2020 we do anticipate that to change given:
Deferral programs from Canadian banks are generally winding down. For those owner-occupied businesses in need of capital, realizing on the equity in their building is a good source of capital.
Government support programs, mainly the Emergency Wage Subsidy (CEWS) has been incredibly valuable for businesses struggling to make ends meet. As this program winds down by mid-Q4, we could once again see owners look to divest real estate as a source of capital.
Canadian Consumer Spending
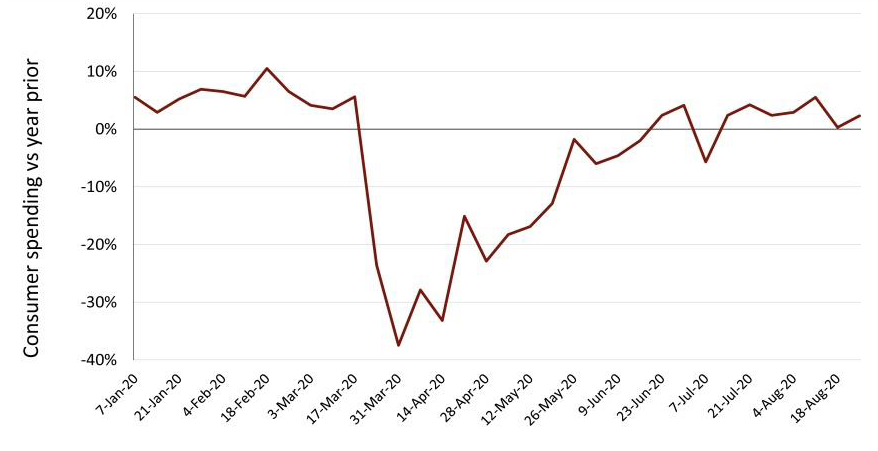
CANADIAN CONSUMER SPENDING (credit card data via RBC Economics)
Consumer spending across Canada has made a remarkable recovery with August credit card data from RBC suggesting overall spending sits roughly 3% above year ago levels. While this is certainly good news, unsurprisingly it has not recovered across the board with travel, parking/transit and entertainment sectors still experiencing cash flow headwinds
Canadian Consumer Spending by Sector vs 2019

SOME SECTORS DOING BETTER THAN OTHERS
While dining has largely recovered from the April lows, consumers continue to spend more at the grocery store than year-ago levels.
Facing the reality of being at home, consumers continue to spend more on household goods and electronics.
Sources: Ritchie Bros. Auctioneers, Diamond Willow Advisory, CBRE, RBC Economics.