What We are Watching: Key Economic Indicators

September 2024
INTEREST RATE POLICY HAS WORKED BUT MIXED SIGNALS ARE EVERYWHERE
With summer behind us and the kids back in school, it seems like the perfect time to take a closer look at some of the key economic indicators we're tracking. The Bank of Canada has made solid progress in managing inflation and cooling the economy through interest rate adjustments, but we’re now beginning to see the more challenging effects of these higher rates in the data. Additionally, Canada’s ongoing labour productivity issues remain a critical area that urgently needs attention.
Key Takeaways this Month:
The Good:
Rate Cuts are Expected to Continue: Data driven cuts are expected to continue
Inflation is Slowing: Canadian Inflation continues to trend in the right direction (down)
Canadian Labour Market Normalizing: Unemployment has risen back to historical levels
The Bad:
Commodities Prices Declining: Canadian Commodity Prices have declined by 4.8% YoY driven by Energy (-7.4% YoY) and Agriculture (-14.3% YoY)
Insolvencies are on the Rise: Business insolvencies are up over 40% YoY
The Downright Ugly:
Labour Productivity Down Again: Canada is in big trouble if we can’t turn this trend around
BoC, US Fed and ECB Historical Target Policy Rate (January 2013 - August 2024)

After an extensive rate hiking cycle, the BoC continues to cut its target rate, others will follow
Canadian GDP Growth/Component Contribution

Canadian GDP grew by 2.1% Q2 2024, driven by government spending (1.5% QoQ growth)
GDP Assessment a Mixed Bag: Canadian growth surprised in Q2 2024, up 2.1% QoQ annualized. Notably, consumer spending slowed during Q2 (growing at 0.6% QoQ, from 3.6% in Q1 2024) while government spending accounted for 63% of total GDP growth in the quarter (up 6.7% QoQ). At a more granular level, consumer spending continues to be strong in the ‘need to have’ categories like food, rent, utilities, but there was a noticeable decline in big ticket purchases, while government spending was above expectations due to increased salary expense and purchases of goods and services.
Labour Productivity and GDP

Labor productivity continues to falter (down -0.2% QoQ and -0.7% YoY in Q2 2024)
Labor Productivity Continues a Horrible Trend: The imbalance between economic growth and labour productivity continued to worsen in Q2 2024 as Real GDP growth rose 0.5% QoQ, while labour productivity declined 0.2% QoQ. Most of the decline in productivity was attributed to service producing businesses, which recorded a 0.3% QoQ decrease. This was largely due to declines in most service sectors, notably information and cultural industries (-2.1%), real estate services (-1.5%) and professional services (-0.9%).
Canadian Inflation Measures, Monthly

CPI Component: The Sandwich Index

CPI Component: The Snack Index

CPI Component: Books & Paper

CPI Component: Clothing & Shoes

Headline and core CPI measures continue to decline in 2024, most recently printing at 2.5% YoY
Inflation (and Back to School Costs) Cooling: Canada’s most recent CPI reading re-affirmed the continued decline in inflationary pressures, coming in at 2.5% YoY in July 2024. Of note for parents, back-to-school costs for items like snacks, books/paper and clothing/shoes followed the trend with inflationary components in these categories printing between -8.4% YoY (children’s footwear) and 5.1% (cookies and crackers). Cookies and crackers (5.1% YoY), Apples (3.2% YoY), Stationary (4.7% YoY) and School Textbooks (3.9% YoY) were the only sub-categories to register above 2.5%.
Canadian Consumer Insolvencies

Canadian Business Insolvencies

Canadian Business insolvencies are up over 40% YoY
Canadian Insolvencies are on the Rise: While CPI pressures are starting to ease, Canadians are still feeling the pressure. On the consumer front, bankruptcies are up 12.8% YoY while consumer proposals, usually used as a future indicator of bankruptcy, are up 15.1% YoY. Canadian business owners are in a worse spot with corporate bankruptcies up 65.0% YoY (YTD as of July 2024/2023), while corporate proposals have increased 42.3% YoY. These trends underscore the ongoing challenges in the Canadian economic environment – we attribute much of these pressures to increased operating/living costs, as well as continued economic softness.
Canadian Commodity Index (Monthly, January 2017 - August 2024)

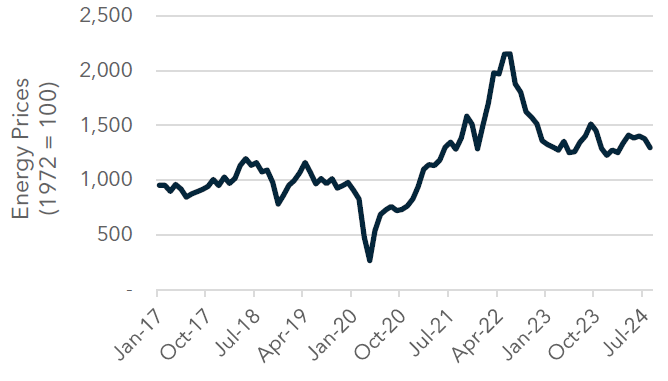
Commodity Component: Energy
Commodity Component: Agriculture

Aggregate Canadian commodities are showing some weakness (down 4.8% YoY in August 2024)
Energy and Agriculture Under Pressure: Canadian commodities, in aggregate, have slightly declined 4.8% YoY, which have largely been driven by a notable decline in energy prices (down 7.4% YoY) and Agriculture prices (down 14.3% YoY). Offsetting the declines in these sectors, were price increases in forestry, metals, and fish of 7.8%, 6.5%, and 4.0%, respectively. We’ll be keeping a close eye on these trends.
Canadian Unemployment Rate and Job Vacancy

The labor market continues to remain balanced with unemployment at 6.4%, job vacancy rate at 3.3%
Balance Continues to Persist in the Labor Market: Over the past 12 months (as of August 2024), 128,300 FT jobs have been added to the Canadian economy while the unemployment rate has risen to 6.4%. Both of these metrics continue to signal that the labor market is re-balancing itself. Job vacancy rates continued to decline and now currently stand at 590,300 – a figure that continues to remain 28% above pre-COVID levels but is down 24.9% from 2023 levels.
Sources: Earning Reports, Statistics Canda, Bank of Canada, Diamond Willow Advisory.