From Eh to Nein: Comparing Canada to the G7

April 2024
WE LOVE OUR COUNTRY BUT CANADIANS SEEM TO LOVE THEIR DEBT
With COVID firmly in the rearview mirror, we are able to gauge the health of key global economies and the leverage impacts of major stimulus programs and low borrowing costs. With high inflation, a symptom of monetary injections throughout COVID, the world's nations have turned their attention to slowing their economies via rising interest rates. This Digest compares the G7 nations on numerous metrics, proving the world’s economies are slowing and that Canada has emerged as one of the most highly levered nations.
KEY TAKEAWAYS THIS MONTH:
Economies Are Slowing: With the exception of the US, all G7 economies are slowing, with Germany’s GDP growth recently turning negative. The US recovered in 2023 and continues to show signs of resiliency. GDP per capita similarly shows a slowing trend, with Canada declining the most out of the G7.
The World Is More Levered Than Ever and Canada Is Leading the Pack: Government debt-to-GDP ratios are down from the COVID highs but still above pre-COVID levels. The only exception is the US which is flat. Corporate debt-to-GDP ratios exhibit a similar trend, with Canada as the most levered and Germany the least. Household debt is down slightly but Canadians are 50% more levered than their G7 peers.
So Far, We Are Able to Service Our Debt: Debt service metrics are fairly flat among the G7 with Canada declining as an exception. Given Canada’s debt levels are among the highest in the G7, this should not come as a surprise but is alarming.
G7 Real GDP Growth Y/Y

G7 ECONOMIC COMPARISON
Real GDP per Capita

Canadian real GDP per capita has declined to seven-year lows and is middle of the G7 pack.
Per Capita Growth Reveals a More Interesting Story: Canada’s rapidly rising population, interprovincial trade barriers, and large Government workforce have led to a decline in labour productivity. This trend is apparent in other G7 nations, with the US and UK being clear exceptions as productivity continues to rise.
Government Debt-to-GDP %
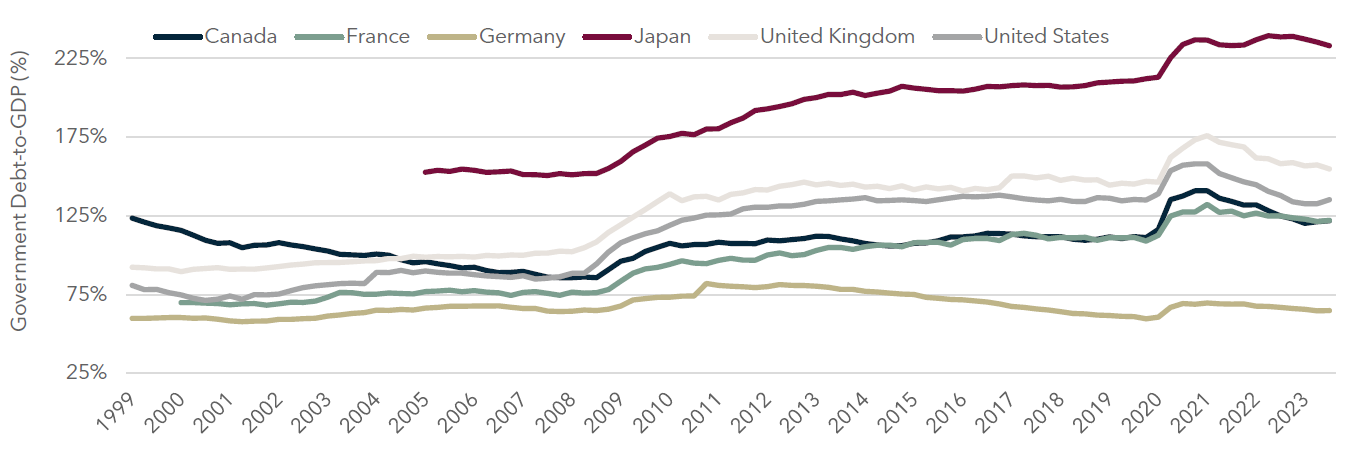
Government debt levels are down from the COVID peaks but still above pre COVID levels. Germany is the exception as they have de-levered.
G7 Government On The Decline: Contrary to popular belief, government debt across the G7 has declined since experiencing a material 22% increase during COVID, on average. Since then (Q4 2020), government debt-to-GDP in G7 nations has declined by approximately 12%. Canada and the US were the only G7 nations to experience an uptick in government debt-to-GDP towards the end of 2023 at 1.6% and 2.5%, respectively. Although down, all countries have increased debt compared to pre COVID levels.
G7 CORPORATE & HOUSEHOLD DEBT
G7 Corporate Debt-to-GDP (Excl. Financial Corporations)
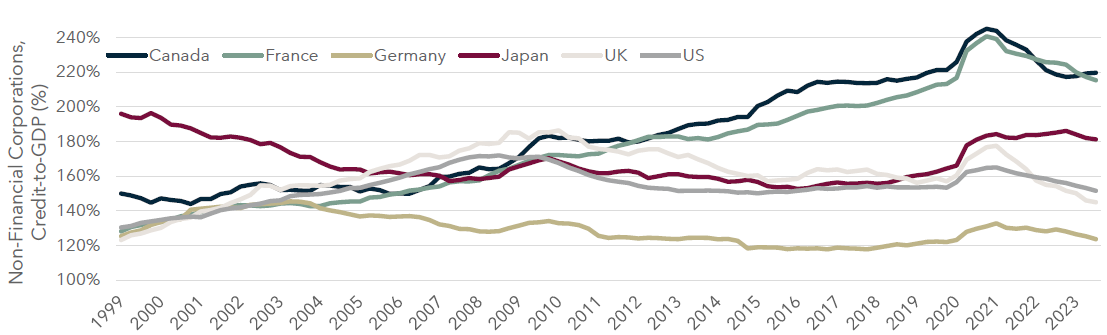
Canadian corporations are the most levered on a debt-to-GDP basis, with Germany again being the least levered.
Non-Financial Credit Generally Decreasing: Non-financial corporations have done a good job deleveraging from COVID, with all but Canada on a decelerating trend. Once again, we see Germany as the least levered and Canada as the most.
Household Debt-to-Disposable Income Y/Y, 2017-2023*

Canadians are the clear leader when it comes to household debt to income - not an enviable position.
Most G7 Nations Are Maintaining or Declining Household Debt: Since 2017, G7 households had a decline in their household debt-to-net disposable income of approximately 2%, on average. Canada, who has a noticeably higher household debt-to-net disposable income, has experienced a reduction in debt but still leads the pack by a wide margin. Germany was the laggard of reporting G7 nations, only experiencing a 3% decline in household debt-to-net disposable income from 2022 to 2023 but is the least levered of the group.
G7 CORPORATE & HOUSEHOLD DEBT SERVICE
Non-Financial Corporations Debt Service Coverage Ratio – Higher is Better

Given Canada’s higher leverage, it should be no surprise we are near the bottom of debt serviceability.
Debt Servicing Consistent in Most of G7: Non-financial corporations in the G7 are mostly remaining consistent with debt servicing, with an average of approximately 2.7x. Canada and France have the lowest ability to service debt at 1.8x and 1.7x, respectively. However, there may be early signs that debt servicing may be deteriorating in Canada.
Household Debt Service Coverage Ratio
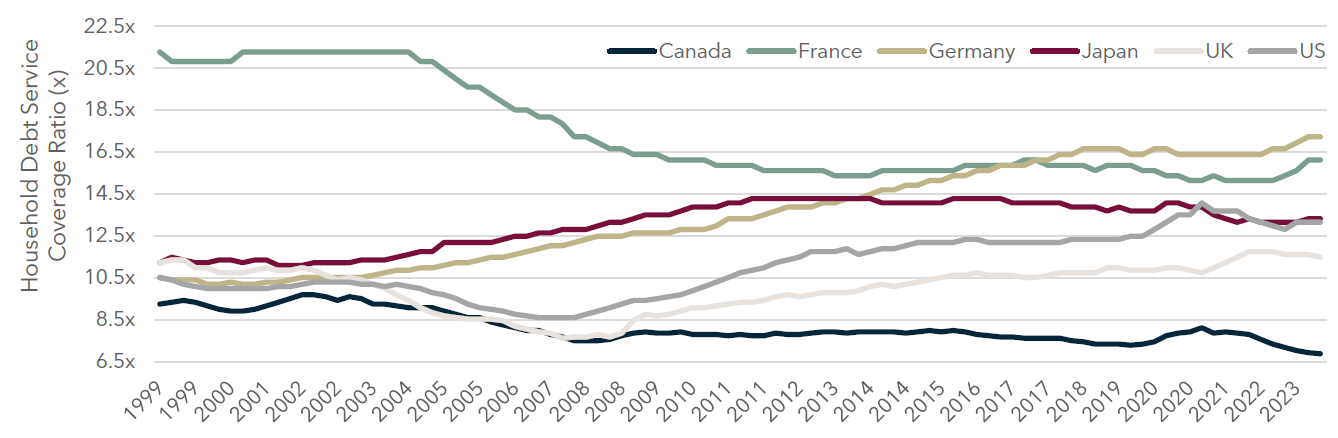
G7 debt service being maintained… but Canadian households are struggling.
G7 Nations Are Generally Maintaining or Improving Debt Servicing: It is irrefutable that the cost of living has increased worldwide, and the G7 nations are no exception. Generally, household debt servicing remained largely stagnant, averaging 13.0x as of Q3 2023. The notable exception is Canada, whose debt service coverage ratio has deteriorated from 7.7x to 6.9x from 2017 to 2023. This trend deserves to be monitored.
Sources: Statistics Canada, OECD, Bank for International Settlements, Diamond Willow Advisory.