A Fiscal Feast: Digging Into Canada's Provincial Budgets

May 2024
HIGHER SPENDING AND DEBT ON THE HORIZON IN CANADA’S 10 PROVINCES
Now that all of Canada’s provincial budgets have been released (and the federal budget has been tabled and approved), it has become clear that “higher spending for longer” is a central theme to support housing affordability, healthcare, education, infrastructure and higher debt servicing costs. However, a softening economic picture, largely supported by high interest rates, has left many taxpayers and investors feeling less optimistic about the future, especially considering Canada’s provinces are projected to run a combined $6.3 billion deficit in 2024 and a $25.3 billion deficit in 2025!
KEY TAKEAWAYS THIS MONTH:
Provinces are Racking up the Debt: Combined, Canada’s 10 provinces are projected to run a cumulative $62.2 billion deficit from 2024-2027. To support the spending for key initiatives, provinces are largely turning towards credit markets to help finance the budgetary shortfalls.
BC and Alberta Shine: BC, Alberta and to a small extent, Saskatchewan, are the only provinces that have a higher contribution to GDP (33%) than their contribution to debt (14%). Ontario and Quebec are high GDP contributors (59%), but account for an even larger amount of debt (77%).
Home Prices and Productivity are at Odds: The price of a home in Canada has risen by 40% since COVID, contributing to the broader increase in the cost of living. Unemployment is on the rise in substantially all of Canada’s provinces, while GDP per capita is declining… not the best combination.
Net Debt-to-GDP by Province (2021A - 2025F)

Debt to GDP is rising in all provinces except Alberta.
Provincial Budget Balance (2021A - 2025F)

Canada’s 10 provinces are projecting a combined deficit of $6.3 billion in 2024 and $25.3 billion in 2025.
PROVINCIAL CONTRIBUTION TO GDP AND NET DEBT (2023)
Provincial Contribution to GDP (2023)

Provincial Contribution to Net Debt (2023)

BC, AB, and SK contribute 19% more to GDP relative to their net debt, while QB and ON have 18% more net debt relative to their GDP contribution.
The Prairies and BC are Rolling, but not in Debt: When combined, BC, Alberta, Ontario and Quebec contribute 88% of the national GDP but also account for 89% of provincial net debt. Further analysis reveals that BC, Alberta, and Saskatchewan are the only provinces that have a higher contribution to GDP (33%) relative to their contribution to provincial net debt (14%). Ontario and Quebec are the opposite, contributing 59% to national GDP but accounting for 77% of all provincial net debt.
Provincial GDP per Capita (2018 - 2023)
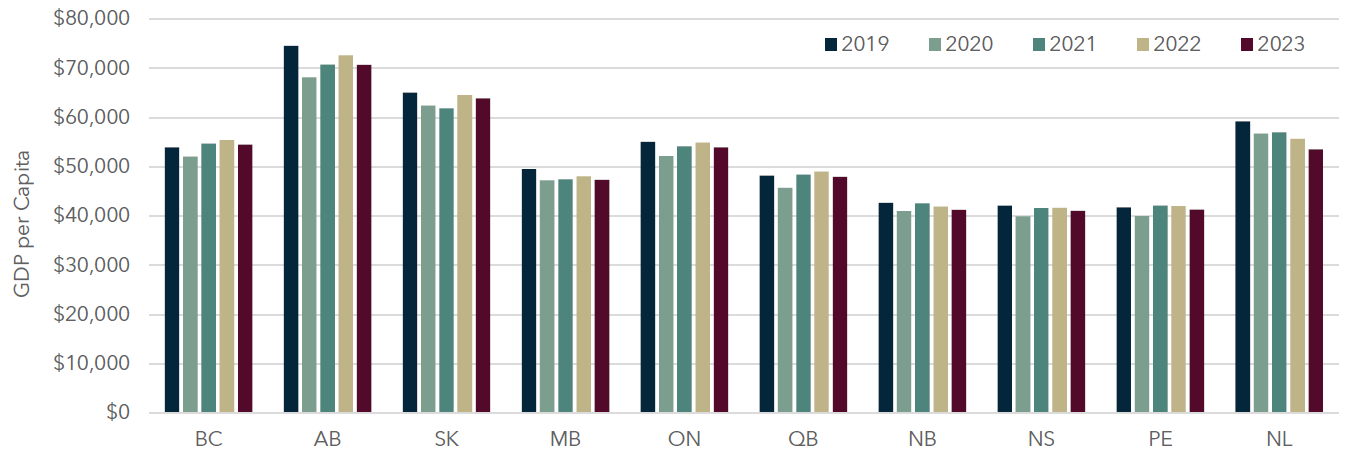
Provincial GDP per capita declined by 2% in 2023, on average.
Provincial GDP per Capita Declining: While substantially all of Canada’s provinces experienced GDP growth in 2023 (1%, on average), the growth was simply not fast enough to keep up with a drastic uptick in population growth (3% on average). As a result, provincial GDP per capita declined by an average of 2% in 2023. It is unclear whether or not there will be a lagged growth effect on GDP per capita going into 2024, but we will continue to monitor the trend.
Average Household Prices by Province (March 2020 - March 2024)

Average home prices continue to rise nationwide, up to 10%, with Alberta having the largest Y/Y increase.
Nationwide Home Prices Rising: On average, Canadian home prices rose by 5.6% from March 2023 to March 2024 and 40% since March 2020 (arguably, the start of COVID). The maritime provinces experienced the largest increase since March 2020 with an average increase of 52%, led by NB at 70%. A mass move into Alberta (see page 4 for details) has driven a large increase in home prices in the province, but we would note that despite the price increases, homes still cost half as much as in BC and ON. Albertans should continue to expect material immigration and a rise in home prices.
Provincial Unemployment (April 2022 - April 2024)

Unemployment rate is on the rise across substantially all Canadian provinces ranging from 5% to 11%.
Unemployment Rates are on the Rise: Provincial unemployment rates are increasing across substantially all Canadian provinces. Ontario, Alberta and Saskatchewan have experienced the largest increases Y/Y with unemployment currently standing at 6.4%, 7.4% and 6.5%, respectively. Specifically related to Alberta, we are unclear if this increase in unemployment is due to the surge in short-term population growth or true unemployment – we will continue to monitor the trend. In contrast, Newfoundland had a decline in its employment rate over the last year, however unemployment in the region remains higher than its provincial peers.
Provincial Intermigration by Quarter (2023)

Alberta continues to have the highest interprovincial migration.
Sources: Statistics Canada, OECD, Bank for International Settlements, Diamond Willow Advisory.