Where, Oh Where Did All the Job Seekers Go?

August 2022
GREAT EMPLOYEES CREATE OPPORTUNITY, BUT THEY’RE HARD TO FIND…
It’s nothing new – great employees create even greater businesses. While this might sound simple, the battle to find employee talent has only continued to intensify in Canada (and around the world) since the onset of COVID-19. With unemployment at an all-time low of 4.9%, the participation rate standing at ~65% and wages increasing at a rate of 5.1% YoY, it’s not surprising that the number of ‘Help Wanted’ signs is on the rise. You might be asking yourself where did all the job seekers go? Is there a labour shortage, too many job postings or are Canadians currently under-employed? Read on to find out.
Our Thoughts: There are not enough workers to fill all of the job vacancies and this imbalance in the labour market will likely persist until the economy slows for a consistent period, but the cracks are starting to show. The labour force has continued to grow annually, but the number of job vacancies/postings is outpacing the number of available workers in almost every industry. There is hope – employers may want to consider: (1) enhancing opportunities for progression/taking on challenging work to reduce employee dissatisfaction, (2) continue to offer flexible work arrangements so employees can satisfy various life goals and (3) consider diversifying hiring practices and look to potential retirees to fill roles.
THE BACKUP DATA
Private vs. Public vs. Self-Employed: The Private sector is growing at ~5.7% YoY (vs. ~1.6% historical rate) and the Public sector is growing at ~5.6% (vs. ~1.3% historical rate). Interestingly, the number of Self-Employed individuals is falling at a rate of -1.8% (vs. 1.8% historical rate), indicating that job seekers are not simply starting their own businesses.
Employment By Sector (Jan 2019 - Jul 2022)

JOB VACANCIES ARE OUTSTRIPPING EMPLOYMENT YoY
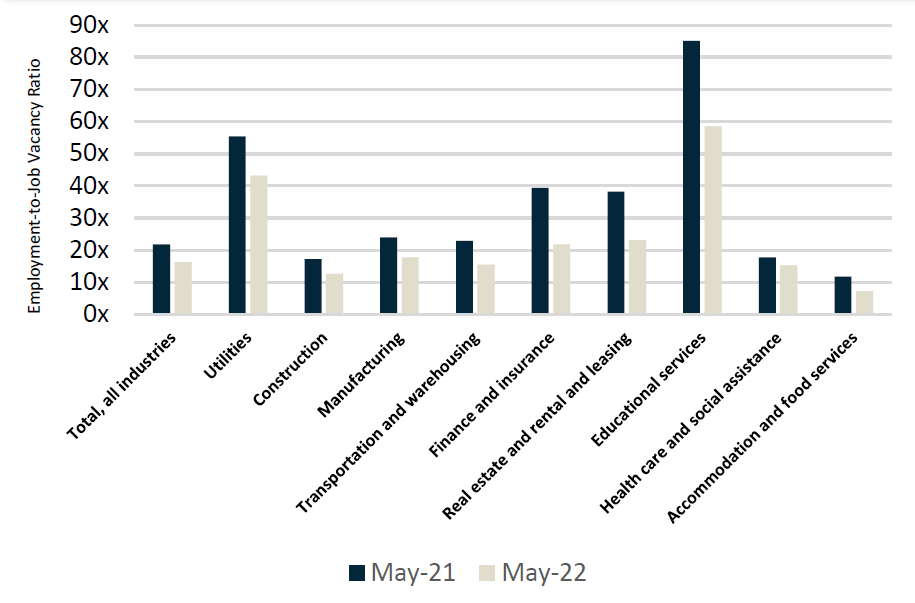
The lower this ratio the tighter the labour market and things are tight. The number of job vacancies in Canada stood at ~1 million in May 2022 (vs. ~700 thousand in May 2021) which is up 43%, far outstripping employment growth of only 6.9% in the same time period (16.5 million in May 2022 vs. 15.4 million in May 2021) on a percentage basis. The Employment-to-Job Vacancy ratio has decreased ~-25% YoY, demonstrating that there is a fundamental demand/supply imbalance in the Canadian labour market across most industries, the tightest being the hospitality sector.
Employment-to-Job Vacancy Ratio, Select Industry
WHY ARE PEOPLE LEAVING THE WORKFORCE?
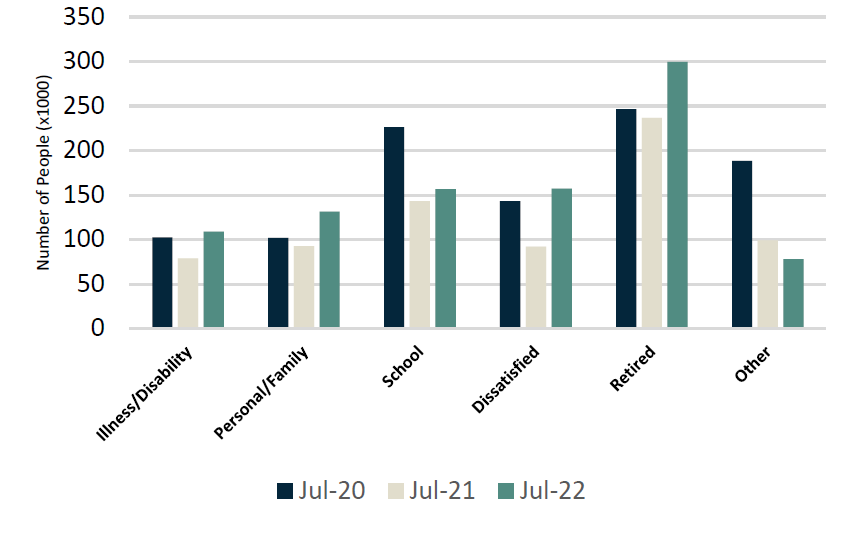
The number of permanent/temporary layoffs declined to a low of ~626 thousand in June 2022 vs. an average of ~1.3 million/month since January 2019 (~1.1 million/month if you exclude COVID months), indicating an employee-driven labour market. However, there was a noticeable uptick in July 2022 at ~853 thousand – we will continue to monitor this trend in the future. Interestingly, the number of people departing the workforce is still below July 2020 and July 2019 levels (~932 thousand in July 2022 vs. ~1 million in July 2020 and ~1.1 million in July 2019), however, is elevated from July 2021 (~743 thousand). The main reason for professionals leaving their jobs in 2022 include dissatisfaction (~70% increase YoY), personal/family reasons (~41% increase YoY) and illness/disability (~38% increase YoY).
Job Leavers: Reasons for Leaving
WHY ARE PEOPLE NOT ENTERING THE WORKFORCE?
The number of Canadians in the labour force has steadily increased since 2019, but there remains a portion of Canadians that do not want to enter the labour force. This figure currently stands at ~10.4 million in July 2022 (vs. ~10.1 million in July 2021). Within this population, there is a minority of Canadians who are not currently in the labour force but want to be employed, however, they are unable to do so at this time. The main reasons behind this are illness/disabilities (~12.3% increase YoY) and going to school (~17.2% increase YoY). The portion of those not in the labour force, but who want to work, has decreased relative to the historical average (412 thousand in July 2022 vs. ~487 thousand historical average), but there was a noticeable uptick in July 2022 vs. June 2022 (412 thousand vs. 376 thousand, respectively) showing rising interest rates may be having an impact on the economy.
Not In Labour Force: Reason For Not Seeking Work

CANADIAN WORKFORCE DEMOGRAPHICS / CHARACTERISTICS ARE CHANGING
There have been some interesting structural developments in the Canadian labour force since January 2019, namely a large influx of female employees who are 65+ and an overall increase in the core workers category (25 to 54 years). On core workers, total employment in the 25 to 54 years category is up ~4.4% YoY (July 2022 vs. July 2021). Youth employment (15 to 24 years) followed the trend and increased 3.3% YoY (with Female growth outpacing that of the Males) and, perhaps most surprisingly, retirement aged (65+) employment has increased by 8% YoY. The increase in retirement aged employment has largely been led by an influx of females – this category has increased 13.4% YoY (compared to 4.9% YoY from male counterparts).
Female Employment (Jan 2019 - Jul 2022, 000s)

Male Employment (Jan 2019 - Jul 2022, 000s)

Female Employment (By Age, 000s)

Male Employment (By Age, 000s)

Female Employment, 65+ (Jan 2019 - Jul 2022, 000s)

Male Employment, 65+ (Jan 2019 - Jul 2022, 000s)

Sources: Statistics Canada, Diamond Willow Advisory.