What Q3 Bank Results Mean for Borrowers

October 2022
CAPITAL IS AVAILABLE IN CANADA BUT SIGNS OF TIGHTENING ARE APPEARING…
Over the past several months it has become increasingly more difficult to find anything in the news that doesn’t predict ‘Economic Armageddon’. While it is evident that economic conditions are tightening, it appears that Canadian businesses continue to have access to debt capital. That being said, those businesses who need additional capital flexibility are advised to seek out options sooner than later.
In Q3/2022, the Canadian Big 6 Banks facilitated a continued expansion of commercial credit facilities, collectively growing their loan book by 18% Y/Y. In addition, Credit Loan Loss Provisions continue to be well-below pre-COVID levels by ~40%, on average, but are seeing a slight uptick compared to prior post-COVID quarters. So, what’s going on with The Big 6 and will these trends continue given mounting economic pressures? Read on to see our thoughts.
Our Thoughts: While lending activity from the Big 6 has increased 18% Y/Y, there is evidence of a decelerating trend, meaning less credit capital is being underwritten as time goes on. In combination with this tightening of the purse strings, banks are increasing their loan loss provisions. We expect this trend will continue and any borrowers who are in need of more flexible capital are advised to quickly evaluate other lending partners such as the ~350 alternative lenders in the DWA network.
THE BACKUP DATA
Canadian Small Business Lending Index: On aggregate, the CSBLI has increased 27% since April 2020 but has regressed since its June 2021 high. Manufacturing and Retail continue to experience growing lending activity (6% and 18 % increase Y/Y, respectively based on July 2022 figures), while Agriculture is showing a decline in lending activity (-17% Y/Y based on July 2022 figures).
Canadian Small Business Lending Index, Jan 2018 - Jul 2022

THE BIG 6 CONTINUE TO EXPAND THEIR COMMERCIAL LOAN BOOK
The main Canadian lenders pivoted their loan appetite in Q3/2021 and haven’t looked back. Since then, overall loan growth has increased 18%. While this growth in credit has been critical to assisting Canadian businesses navigate out of COVID, loan growth in Q3/2022 is beginning to demonstrate a continued deceleration trend compared to prior quarters. Q/Q% growth in Q3/2022 was only 4.6% compared to 5.3% in Q2/2022 and 6.3% in Q1/2022. Given the aggressive monetary policy instituted by the Bank of Canada, we expect this deceleration trend to continue into the future. Interestingly, the timing of the growth in The Big 6’s loan book perfectly matches historical trends – after the crash in 2008, it took 5 quarters before The Big 6 begin increasing their loan book.
The Big 6: Total Loans Outstanding, Q1/2019 - Q3/2022

GROSS IMPAIRED LOANS CONTINUE TO DECLINE
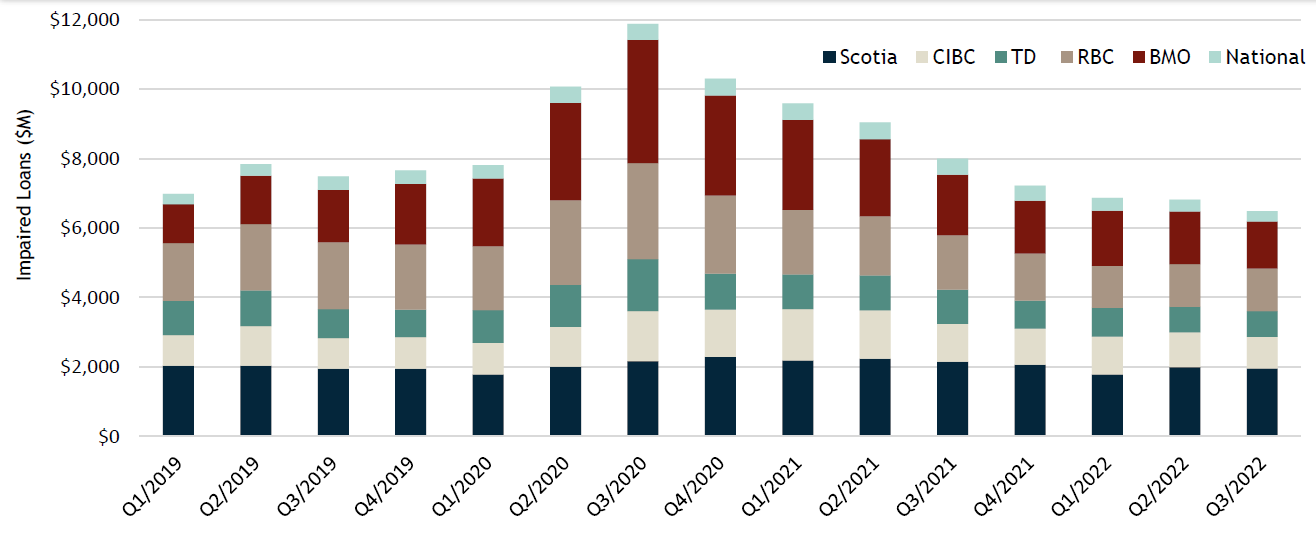
Gross impaired loans have continued to normalize back to and below pre-COVID levels, having decreased 5% Q/Q and 19% Y/Y in Q3/2022. On a aggregate basis, gross impaired loans now account for ~0.5% of total outstanding commercial loans provided by The Big 6 which is slightly less than the ~0.7% of total outstanding loans pre-COVID. All sectors, with the exception of the service industry (i.e. hospitality and food services), followed this aggregate trend of normalizing to or below pre-COVID levels. The service industry has marginally increased to 0.4% compared with 0.3% pre-COVID.
The Big 6: Gross Impaired Loans, Q1/2019 - Q3/2022
CREDIT LOAN LOSS PROVISIONS ARE BACK
It appears that the trend of negative provisions has ended, and The Big 6 are beginning to build up an allowance amount to offset any future anticipated losses. In fact, Credit Loan Loss Provisions are up 468% Q/Q and 428% Y/Y. While a data point isn’t indicative of a trend, it is worth noting: (1) credit loan loss provisions continue to be well-below historical averages at 0.11% of total loans outstanding vs. 0.25% during the preCOVID era and (2) Stage 1 & 2 Credit Loan Loss Provisions have become positive, which is largely driving the increase. The Big 6’s Q4 earnings report will provide more detail on whether this uptick will continue.
The Big 6: Credit Loan Loss Provisions, Q1/2019 - Q3/2022

The Big 6: Select Industries Total Credit Outstanding vs. Impaired Loan %, Q4/2013 - Q3/2022
AGRICULTURE LENDING UP, IMPAIRED LOANS DOWN
Unlike the overall trend in Canadian Small Business Lending, the Big 6 have increased the size of their agriculture loan book by 17% YoY. This is likely attributed to lending to larger operations, which often have more disposable capital and collateral for expansion activity. In addition, this trend largely supports the continued pressure on the agriculture industry to produce more in the wake of the Ukrainian war.
The Big 6: Agriculture Total Credit Outstanding vs. Impaired Loan %, Q4/2013 - Q3/2022

NO MORE RETAIL AND WHOLESALE LENDING DROUGHT
Retail and wholesale lending continues to be healthy and normalizing to pre-COVID levels. Y/Y growth from the Big 6 was 23% compared with 18% from the Canadian Small Business Lending Index. Impaired loans continue to decline to pre-COVID levels of sub-1%. It appears that the expansion efforts of several retailers, both big and small, are being supported by the Canadian Big 6 Banks and lenders across the country alike.
The Big 6: Retail & Wholesale Total Credit Outstanding vs. Impaired Loan %, Q4/2013 - Q3/2022

MANUFACTURING IS MAKING A COMEBACK
Canadian finished product manufacturing is up 16% Y/Y as of July 2022, so it follows that lending activity in the space has also rebounded. On a Y/Y basis, lending in the space has increased 29% and impaired loans have been reduced to a normalized pre-COVID level of 0.6%.
The Big 6: Manufacturing Total Credit Outstanding vs. Impaired Loan %, Q4/2013 - Q3/2022

ENERGY CONTINUES TO DECLINE
Capital availability for energy continues to decline, which largely support the Big 6’s overall strategy of transitioning away from non-renewable lending. Loans outstanding declined by 32% Y/Y, while impaired loans also declined to sub-1%. Energy companies likely aren’t feeling the pinch like they were pre-COVID due to the elevation in energy prices, but these companies will likely have to navigate a difficult capital landscape if this trend was to reverse.
The Big 6: Energy Total Credit Outstanding vs. Impaired Loan %, Q4/2013 - Q3/2022

Sources: PayNet, Company Reports, Diamond Willow Advisory.